Stats
Maturity:
Depth:
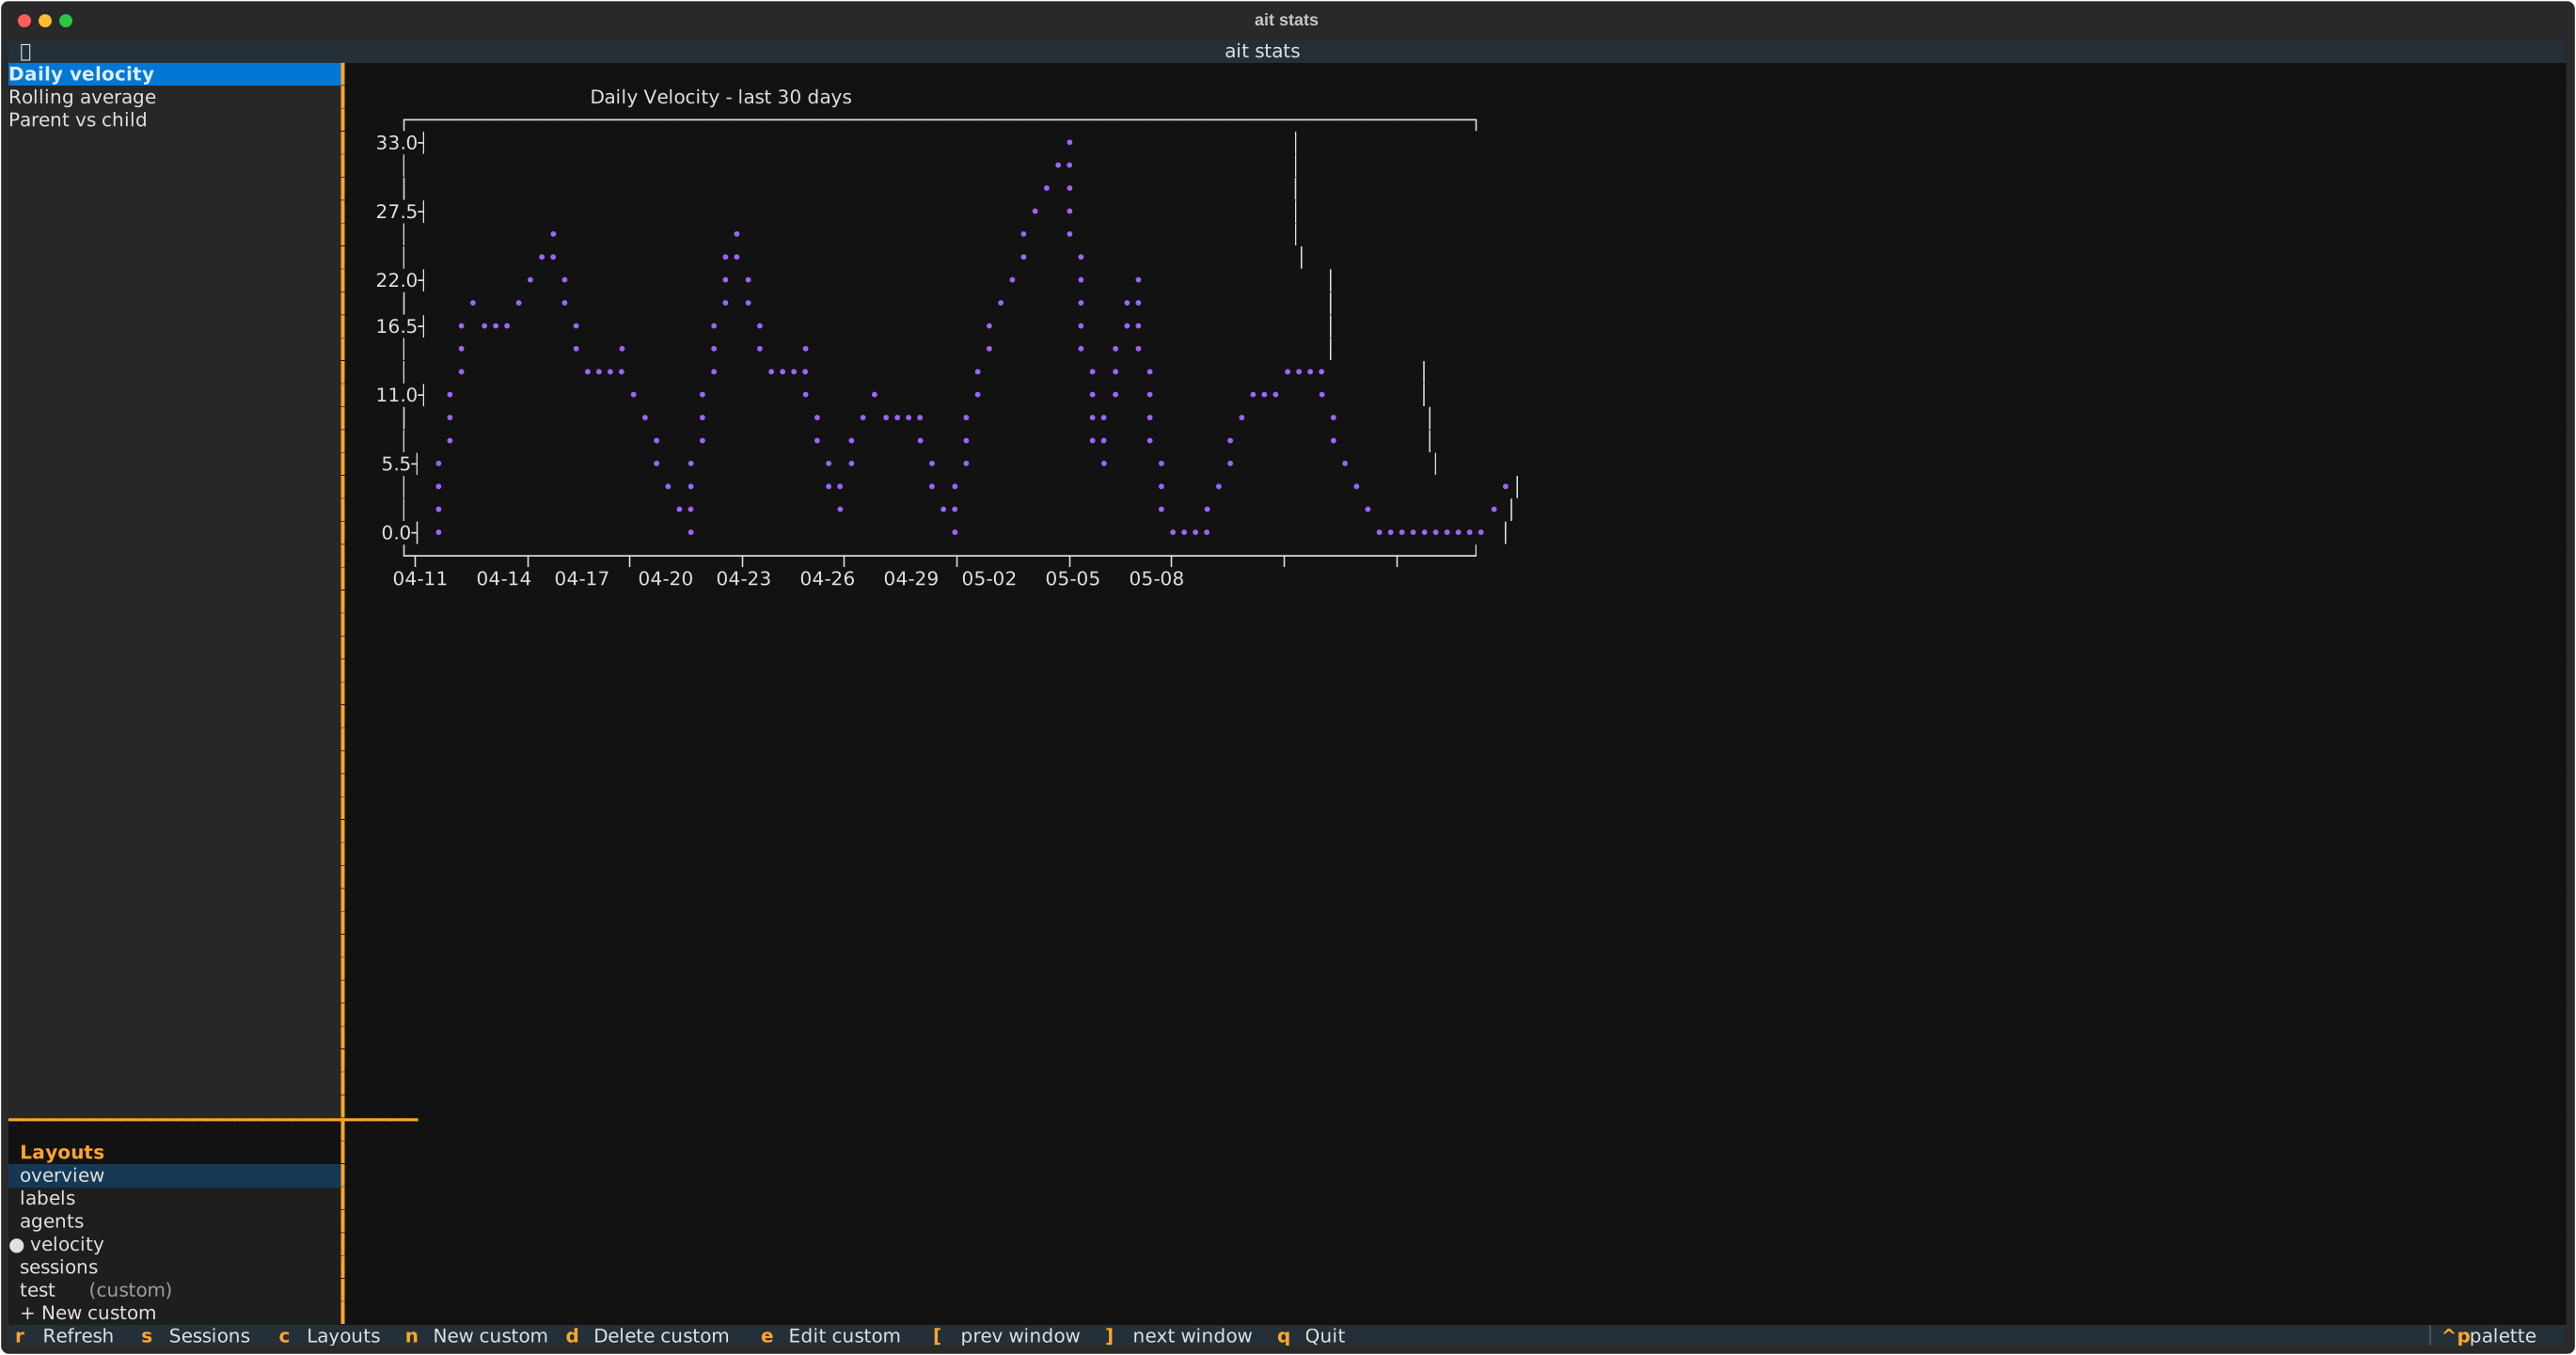
The Stats TUI with the overview layout active.
Customizable keys: every shortcut here can be rebound. Press
?in this TUI for the in-place editor, or open Settings → Shortcuts.
Launching
ait stats-tui
The Stats TUI requires the shared Python virtual environment (installed by ait setup) with the textual, pyyaml, and plotext packages. All three are installed and version-pinned by ait setup, so the interactive chart panes work out of the box.
Inside tmux you can also reach the TUI via the TUI switcher — press j in any other aitasks TUI and pick Stats.
When multiple aitasks tmux sessions are available, Stats uses the same project-group navigation model as the TUI switcher. Left / Right cycles the current session ring; [ / ] changes project-group on most panes. On the agent ranking panes, [ / ] keep their time-window behavior instead.
Purpose
Stats is the interactive, pane-based view of your task statistics. It reuses the same lib/stats_data.py extraction module that backs the text-only ait stats command — the two share a single source of truth for summary counts, daily/weekly trends, label and issue-type breakdowns, code agent / LLM model histograms, verified model score rankings, and the backlog level / net-flow series.
Data scope: the completion metrics are drawn from the task archive. The backlog panes and the in-flight pipeline pane also read your active tasks — an open task is by definition not archived.
Use ait stats for a scrollable text report you can pipe or redirect; use ait stats-tui when you want to flip between charts, try different layout combinations, or watch a single pane full-width.
Layout
┌──────────────┬──────────────────┐
│  sidebar     │                  │
│  (active     │   content        │
│   layout     │   (chart or      │
│   panes)     │    summary)      │
├──────────────┤                  │
│  layout      │                  │
│  picker      │                  │
└──────────────┴──────────────────┘
The left column is split into two list panels:
- Pane sidebar (top) — the panes that belong to the currently active layout. Highlighting a row shows that pane immediately on the right; no Enter needed.
- Layout picker (bottom) — the set of available layouts. The active layout is marked with a
●bullet. Press Enter on a row to activate that layout (its panes replace the sidebar contents).
Tab / Shift+Tab flips focus between the two list panels, and the focused panel gets a primary-colored left border as a visual hint.
Built-in layouts (presets)
The framework ships these presets:
| Preset | Panes |
|---|---|
| overview | Summary · Daily completions · Weekday distribution |
| labels | Top labels · Issue types · Label × week |
| agents | Per agent (4w) · Per model (4w) · Verified rankings · Usage rankings |
| velocity | Daily velocity · Rolling average · Parent vs child |
| pipeline | Time in phase · In-flight (gated) |
| sessions | Per-session totals · Summary · Daily completions |
| backlog | Backlog level · Net flow |
Presets are defined in .aitask-scripts/stats/stats_config.py and are read-only at runtime: they cannot be edited from inside the TUI.
A project can override them by adding a presets block to aitasks/metadata/stats_config.json. That layer is merged per preset key: a preset that exists only in the shipped definitions still appears, while a preset whose pane list is pinned in the JSON replaces the shipped list for that preset wholesale — so a project that pins a preset does not pick up panes later added to it.
The backlog panes
The backlog preset answers a different question from the rest of the TUI: not “how much did we complete?” but “how much is outstanding, of what kind, and is it growing faster than we burn it down?”. Both panes cover a fixed 8-week horizon with weeks starting on Monday — there is no TUI equivalent of ait stats --backlog-weeks.
- Backlog level — a weekly count of open tasks per category, grouped into follow-up categories and genuine new work with a subtotal for each, then
TOTAL OPENand its parent / child partition. Columns run chronologically, with the current week last. - Net flow — the arrivals and departures behind that movement: an
ARRIVALS/DEPARTURES/NETstrip per week, over a chart of the most active categories. Chart series are ranked by volume across the horizon (arrivals plus departures), not by net, so a category that arrives and departs in equal numbers is not hidden just because it nets to zero.
Both panes cap how many categories they draw, which the text report never does:
- The level table shows a block of six or fewer categories in full. Above that, five are shown and the remainder is summed into an
Otherrow. - The net-flow chart plots at most four categories plus an
Otherseries.
The totals are never capped. TOTAL OPEN and the ARRIVALS / DEPARTURES / NET rows are computed over every category, so they stay correct when a cap engages — and cannot be reproduced by adding up the visible rows.
Custom layouts
You can define your own layouts on top of the presets. With focus on the layout picker:
- n — create a new custom layout. You are prompted for a name (must be unique across presets and existing customs), then a pane selector opens where you tick the panes you want to include.
- e — edit the highlighted custom layout’s pane list. Opens the same pane selector pre-populated with the current selection.
- d — delete the highlighted custom layout. Only custom layouts can be deleted; presets are protected.
Custom layouts appear below the presets in the picker with a [dim](custom) suffix.
Config persistence
The TUI uses a layered configuration:
- Project layer —
aitasks/metadata/stats_config.jsonis checked into git and may pin or override preset pane lists (see Built-in layouts). It is treated as read-only at runtime. - User layer —
aitasks/metadata/stats_config.local.jsonis gitignored and holds your runtime choices: the active layout name, your custom layouts, and thedays/week_startpreferences. Every Enter on the layout picker and every successful custom-layout save writes to this file.
This split keeps shared presets consistent across a team while letting each developer keep their own customizations local.
Mouse Support
The Stats TUI supports full mouse interaction in addition to the keyboard shortcuts:
- Click a pane name in the sidebar — show that pane on the right (mirrors highlighting via ↑ / ↓).
- Click a layout name in the layout picker — highlight it; click again (or press Enter) to activate.
- Scroll wheel — scroll the sidebar, layout picker, or chart content.
- Click dialog buttons — buttons in the new-/edit-/delete-layout dialogs and the pane selector are clickable.
All keyboard actions documented below remain available.
Navigating
| Key | Action |
|---|---|
| ↑ / ↓ | Move highlight in the focused panel (sidebar highlights a pane, layout picker highlights a layout) |
| Enter | Activate the highlighted layout (on the layout picker); sidebar panes show on highlight — no Enter needed |
| Tab / Shift+Tab | Switch focus between sidebar and layout picker |
| Left / Right | Cycle sessions in the current project-group ring |
| [ / ] | Change time window on agent ranking panes; change project-group elsewhere |
| c | Jump focus to the layout picker |
| n | New custom layout (focus must be on layout picker) |
| e | Edit highlighted custom layout |
| d | Delete highlighted custom layout |
| r | Reload task data |
| j | Open the TUI switcher |
| q | Quit |
Next: Back to the TUI overview or jump to the text command ait stats.